AnyCable Instrumentation
AnyCable server provides useful statistical information about the service (such as the number of connected clients, received messages, etc.).
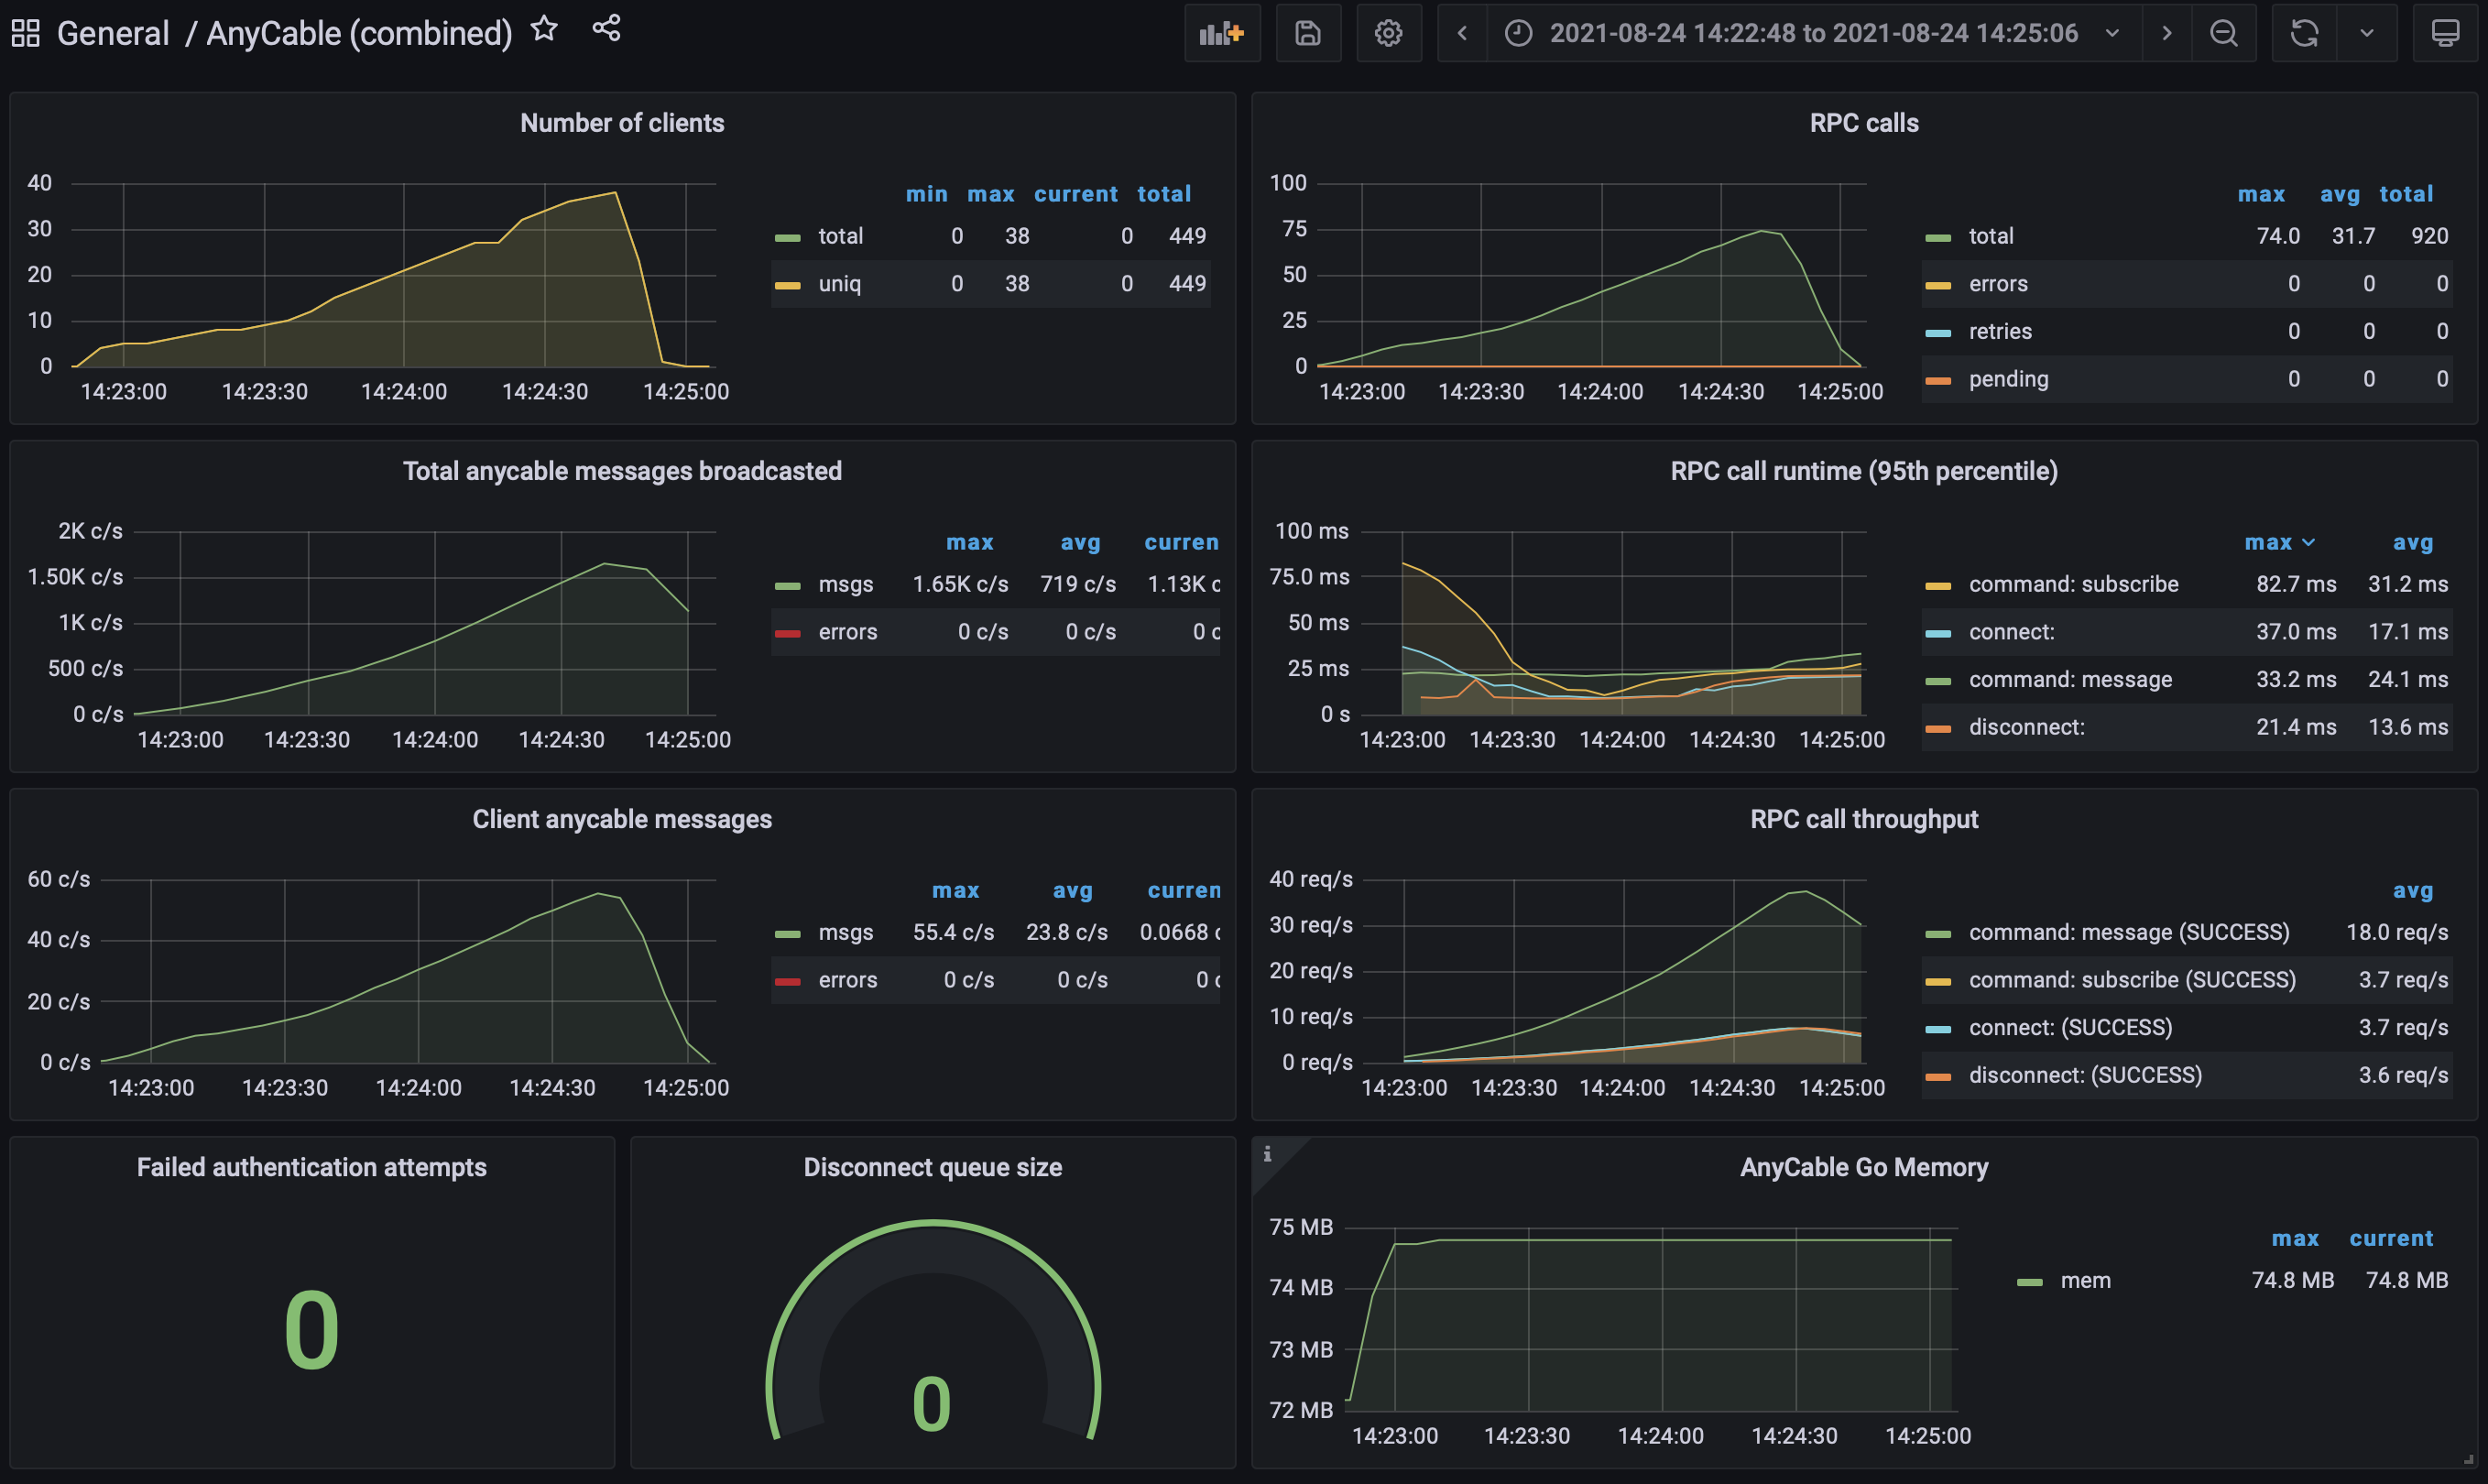
Read the "Real-time stress: AnyCable, k6, WebSockets, and Yabeda" post to learn more about AnyCable observability and see example Grafana dashboards.
Metrics and what can we learn from them
Instrumentation exists to help us preventing and identifying performance issues. Here we provide the list of the most crucial metrics and how to interpret their values.
NOTE: Some values are updated at real time, others (interval metrics) are updated periodically (every 5 seconds by default, could be configured via the stats_refresh_interval configuration parameter). Interval metrics are marked with the ⏱ icon below.
NOTE: The *_total metrics are counters; when printing metrics to logs, the delta between two subsequent metrics collections is displayed; Prometheus works with absolute (i.e., cumulative) values and interpolates them on its own.
⏱ clients_num / clients_uniq_num
The clients_num shows the current number of active sessions (WebSocket connections). A session is considered activated as soon as it has been authenticated and until the connection is closed.
The clients_uniq_num shows the current number of unique connection identifiers across the active sessions. A connection identifier is a combination of identified_by values for the corresponding Connection object.
One the useful derivative of these two metrics is the clients_uniq_num / clients_num ratio. If it's much less than 1 and is decreasing, that could be an indicator of an improper connection managements at the client side (e.g., creating a client per a component mount or a Turbo navigation instead of re-using a singleton).
rpc_call_total, rpc_error_total, rpc_retries_total, rpc_timeouts_total, rpc_pending_num, etc
These are the vital metrics of the RPC communication channel.
The rpc_error_total describes the number of failed RPC calls. This is the actual number of commands that failed. The most common reason for the is a lack of network connectivity with the RPC service. Another potential reason is the RPC schema incompatibility (in that case, most RPC requests would fail, i.e., rpc_call_total / rpc_error_total tends to 1).
The rpc_retries_total describes the number of retried RPC calls. Retries could happen if the RPC server is exhausted or unavailable (no network connectivity). The former indicates that concurrency settings for RPC and anycable-go went out of sync (see here).
The rpc_timeouts_total shows the number of timed out RPC requests. Use this metric to tune the RPC timeout settings (--rpc_request_timeout).
The rpc_canceled_total shows the number of RPC calls that were discarded due to the initiator (the connection) being terminated. Higher values could indicate either misbehaving clients (connecting, subscribing and disconnecting too quickly) or lack of RPC capacity to process all incoming commands (in this case, it should correlate with timeouts).
The rpc_pending_num is the key latency metrics of AnyCable-Go. We limit the number of concurrent RPC requests (to prevent the RPC server exhaustion and retries). If the number of pending requests grows (which means we can not keep up with the rate of incoming messages), you should consider either tuning concurrency settings or scale up your cluster.
publications_total / broadcast_msg_total / remote_commands_total
We provide various metrics around broadcasting functionality that could help you to identify problems in different parts of the AnyCable's pub/sub architecture.
The publications_total describes the number of publication requests received from the application through a non-distributed broadcasting interface (e.g., HTTP or Redis Streams). Each publication is processed only by a single node in the cluster, so the values could tell you how the publications are distributed and whether there is a connectivity between the application and the AnyCable cluster. Both message broadcasts and remote commands are considered publications for this metrics.
The broadcast_msg_total describes the number of broadcasts (i.e., attempts to send a message to clients connected to a given stream) performed by the server instance. The value is incremented by each server in the cluster for each publication. Note that when using HTTP or Redis Streams broadcaster, this value is only updated when there are registered clients for the stream. When using legacy NATS or Redis Pub/Sub broadcasters, the value is incremented for each publication.
failed_auths_total
This failed_auths_total indicates the total number of unauthenticated connection attempts and has a special purpose: it helps you identify misconfigured client credentials and malicious behaviour. Ideally, the change rate of this number should be low comparing to the clients_num.)
⏱ disconnect_queue_size
The disconnect_queue_size shows the current number of pending Disconnect calls. AnyCable-Go performs Disconnect calls in the background with some throttling (by default, 100 calls per second).
During the normal operation, the value should be close to zero most of the a time. Larger values or growth could indicate inefficient client-side connection management (high re-connection rate). Spikes could indicate mass disconnect events.
⏱ goroutines_num
The goroutines_num metrics is meant for debugging Go routines leak purposes. The number should be O(N), where N is the clients_num value for the OSS version and should be O(1) for the PRO version (unless IO polling is disabled).
mem_sys_bytes
The total bytes of memory obtained from the OS (according to runtime.MemStats.Sys).
You can also enabled detailed memory usage metrics by providing the ANYCABLE_MEMORY_METRICS=1 environment variable. That would add additional metrics as in the example below:
heap_alloc_total=2226352 heap_idle_bytes=4104192 heap_released_bytes=4104192 heap_sys_bytes=7569408 mem_sys_bytes=13912328stack_sys_bytes=819200Prometheus
To enable a HTTP endpoint to serve Prometheus-compatible metrics (disabled by default) you must specify --metrics_http option (e.g. --metrics_http="/metrics").
You can also change a listening port and listening host through --metrics_port and --metrics_host options respectively (by default the same as the main (websocket) server port and host, i.e., using the same server).
The exported metrics format is the following (NOTE: the list above is just an example and could be incomplete):
# HELP anycable_go_clients_num The number of active clients
# TYPE anycable_go_clients_num gauge
anycable_go_clients_num 0

# HELP anycable_go_clients_uniq_num The number of unique clients (with respect to connection identifiers)
# TYPE anycable_go_clients_uniq_num gauge
anycable_go_clients_uniq_num 0

# HELP anycable_go_client_msg_total The total number of received messages from clients
# TYPE anycable_go_client_msg_total counter
anycable_go_client_msg_total 5906

# HELP anycable_go_failed_client_msg_total The total number of unrecognized messages received from clients
# TYPE anycable_go_failed_client_msg_total counter
anycable_go_failed_client_msg_total 0

# HELP anycable_go_broadcast_msg_total The total number of messages received through PubSub (for broadcast)
# TYPE anycable_go_broadcast_msg_total counter
anycable_go_broadcast_msg_total 956

# HELP anycable_go_failed_broadcast_msg_total The total number of unrecognized messages received through PubSub
# TYPE anycable_go_failed_broadcast_msg_total counter
anycable_go_failed_broadcast_msg_total 0

# HELP anycable_go_broadcast_streams_num The number of active broadcasting streams
# TYPE anycable_go_broadcast_streams_num gauge
anycable_go_broadcast_streams_num 0

# HELP anycable_go_rpc_call_total The total number of RPC calls
# TYPE anycable_go_rpc_call_total counter
anycable_go_rpc_call_total 15808

# HELP anycable_go_rpc_error_total The total number of failed RPC calls
# TYPE anycable_go_rpc_error_total counter
anycable_go_rpc_error_total 0

# HELP anycable_go_rpc_retries_total The total number of RPC call retries
# TYPE anycable_go_rpc_retries_total counter
anycable_go_rpc_retries_total 0

# HELP anycable_go_rpc_pending_num The number of pending RPC calls
# TYPE anycable_go_rpc_pending_num gauge
anycable_go_rpc_pending_num 0

# HELP anycable_go_failed_auths_total The total number of failed authentication attempts
# TYPE anycable_go_failed_auths_total counter
anycable_go_failed_auths_total 0

# HELP anycable_go_goroutines_num The number of Go routines
# TYPE anycable_go_goroutines_num gauge
anycable_go_goroutines_num 5222

# HELP anycable_go_disconnect_queue_size The size of delayed disconnect
# TYPE anycable_go_disconnect_queue_size gauge
anycable_go_disconnect_queue_size 0

# HELP anycable_go_server_msg_total The total number of messages sent to clients
# TYPE anycable_go_server_msg_total counter
anycable_go_server_msg_total 453

# HELP anycable_go_failed_server_msg_total The total number of messages failed to send to clients
# TYPE anycable_go_failed_server_msg_total counter
anycable_go_failed_server_msg_total 0

# HELP anycable_go_data_sent_total The total amount of bytes sent to clients
# TYPE anycable_go_data_sent_total counter
anycable_go_data_sent_total 1232434334

# HELP anycable_go_data_rcvd_total The total amount of bytes received from clients
# TYPE anycable_go_data_rcvd_total counter
anycable_go_data_rcvd_total 434334
StatsD
AnyCable also supports emitting real-time metrics to StatsD.
For that, you must specify the StatsD server UDP host:
anycable-go -statsd_host=localhost:8125Metrics are pushed with the anycable_go. prefix by default. You can override it by specifying the statsd_prefix parameter. Find more info about StatsD metric types here.
Example payload:
anycable_go.mem_sys_bytes:15516936|g
anycable_go.clients_num:0|g
anycable_go.clients_uniq_num:0|g
anycable_go.broadcast_streams_num:0|g
anycable_go.disconnect_queue_size:0|g
anycable_go.rpc_pending_num:0|g
anycable_go.failed_server_msg_total:1|c
anycable_go.rpc_call_total:1|c
anycable_go.rpc_retries_total:1|c
anycable_go.rpc_error_total:1|c
Default metrics tags
You can define global tags (added to every reported metric by default) for Prometheus (reported as labels) and StatsD. For example, we can add environment and node information:
anycable-go --metrics_tags=environment:production,node_id:xyz
# or via environment variables
ANYCABLE_METRICS_TAGS=environment:production,node_id:xyz anycable-go
For StatsD, you can specify tags format: "datadog" (default), "influxdb", or "graphite". Use the statsd_tag_format configuration parameter for that.
Logging
Another option is to periodically write stats to log (with info level).
To enable metrics logging pass --metrics_log flag.
Your logs should contain something like this:
INFO 2018-03-06T14:16:27.872Z broadcast_msg_total=0 broadcast_streams_num=0 client_msg_total=0 clients_num=0 clients_uniq_num=0 context=metrics disconnect_queue_size=0 failed_auths_total=0 failed_broadcast_msg_total=0 failed_client_msg_total=0 goroutines_num=35 rpc_call_total=0 rpc_error_total=0By default, metrics are logged every 15 seconds (you can change this behavior through --metrics_rotate_interval option).
By default, all available metrics are logged. You can specify a subset of metrics to print to logs via the --metrics_log_filter option. For example:
$ anycable-go --metrics_log_filter=clients_num,rpc_call_total,rpc_error_total

...
INFO 2023-02-21T15:49:25.744Z context=metrics Log metrics every 15s (only selected fields: clients_num, rpc_call_total, rpc_error_total)
...
Custom loggers with mruby
👨🔬 This is an experimental API and could change in the future 👩🔬
AnyCable-Go allows you to write custom log formatters using an embedded mruby engine.
mruby is the lightweight implementation of the Ruby language. Hence it is possible to use Ruby to write metrics exporters.
First, you should download the version of anycable-go with mruby (it's not included by default): these binaries have -mrb suffix right after the version (i.e. anycable-go-1.0.0-mrb-linux-amd64).
NOTE: only MacOS and Linux are supported.
NOTE: when a server with mruby support is starting you should the following message:
$ anycable-go

INFO 2019-08-07T16:37:46.387Z context=main Starting AnyCable v0.6.2-13-gd421927 (with mruby 1.2.0 (2015-11-17)) (pid: 1362)
Secondly, write a Ruby script implementing a simple interface:
# Module MUST be named MetricsFormatter
module MetricsFormatter
  # The only required method is .call.
  #
  # It accepts the metrics Hash and MUST return a string
  def self.call(data)
    data.to_json
  end
end
Finally, specify --metrics_log_formatter when running a server:
anycable-go --metrics_log_formatter path/to/custom_printer.rbExample
This a Librato-compatible printer:
module MetricsFormatter
  def self.call(data)
    parts = []

    data.each do |key, value|
      parts << "sample##{key}=#{value}"
    end

    parts.join(" ")
  end
endINFO 2018-04-27T14:11:59.701Z sample#clients_num=0 sample#clients_uniq_num=0 sample#goroutines_num=0